Experimental views
The graph has two views besides Timeline and Compact, for looking at history another way. They're experimental: off until you ask for them, and they may change or go away in any version, even a patch release. They're outside what a version promises.
To try one, open Settings (Ctrl+,) and tick Horizontal or Map under Experimental views. The view joins the view menu above the graph, under a handwritten "experimental" label. Pick it there, and pick Timeline to go back. The view you pick is remembered, as Timeline and Compact are. Untick a view in Settings and the graph goes back to the rows.
Both views read the same history as the timeline and share its selection, so a commit you choose in one is the commit selected when you switch back.
Horizontal
Horizontal turns the timeline on its side: time runs across, a column for each commit, with the newest on the left, and each lane is a row.
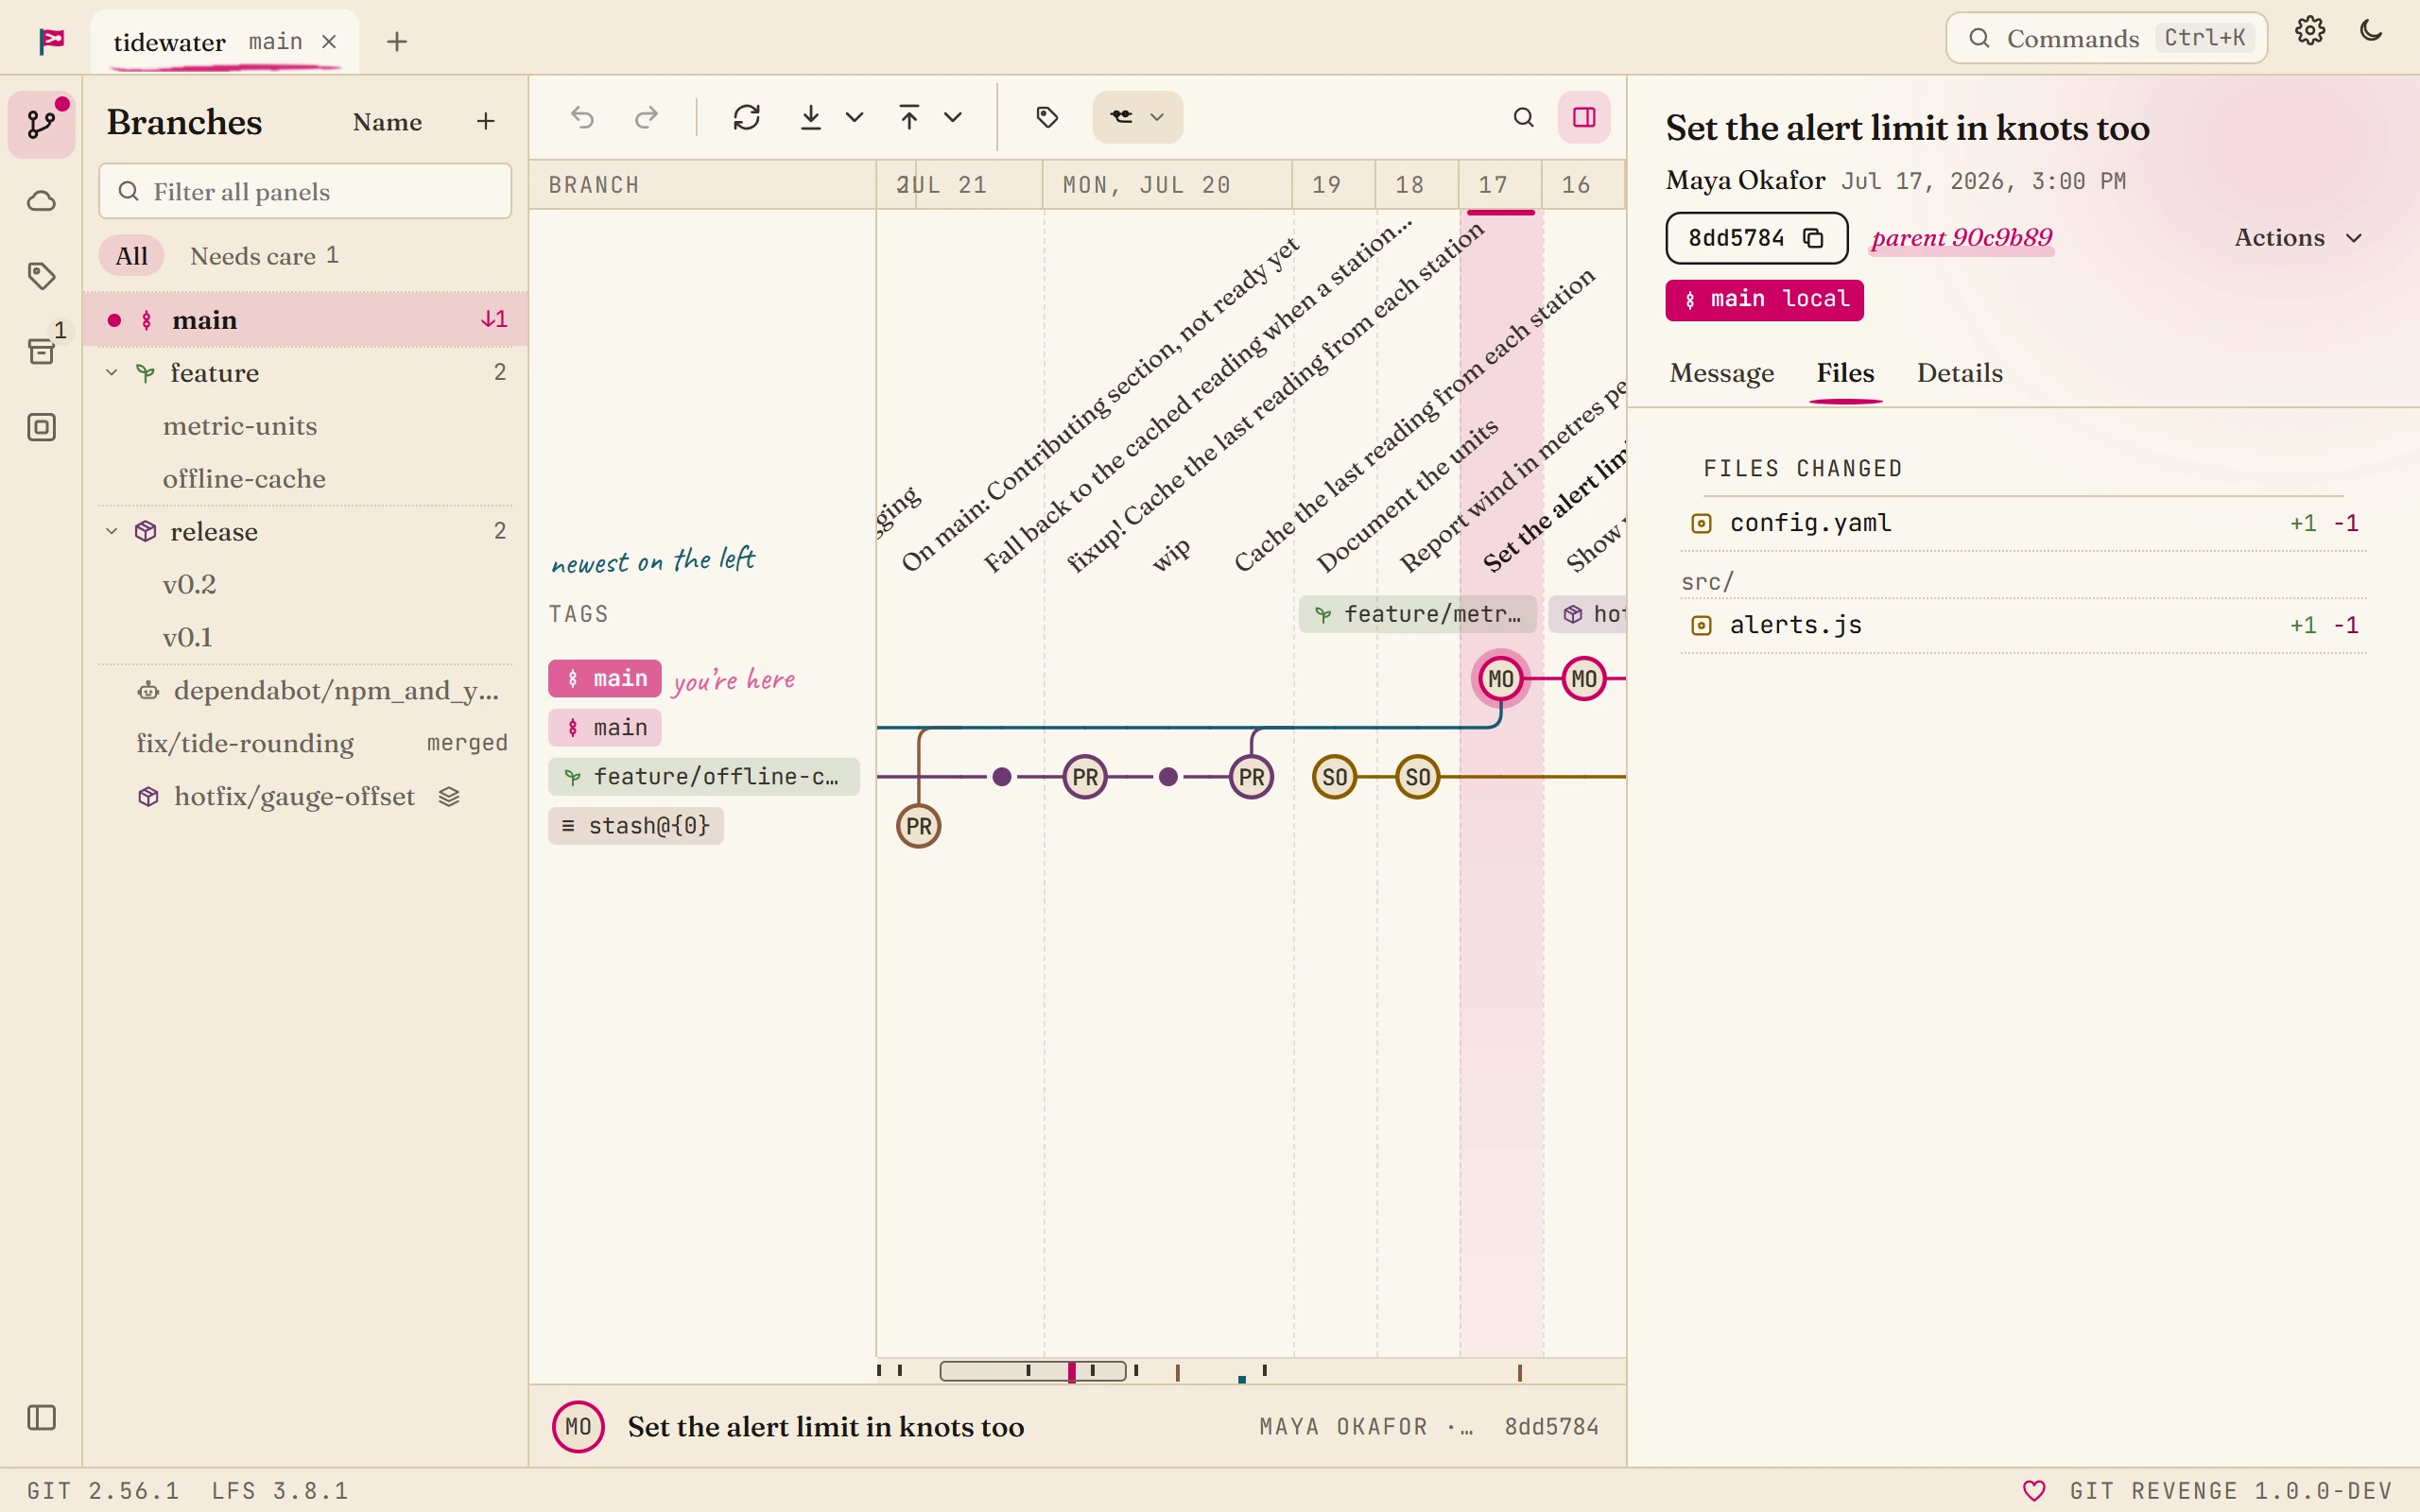
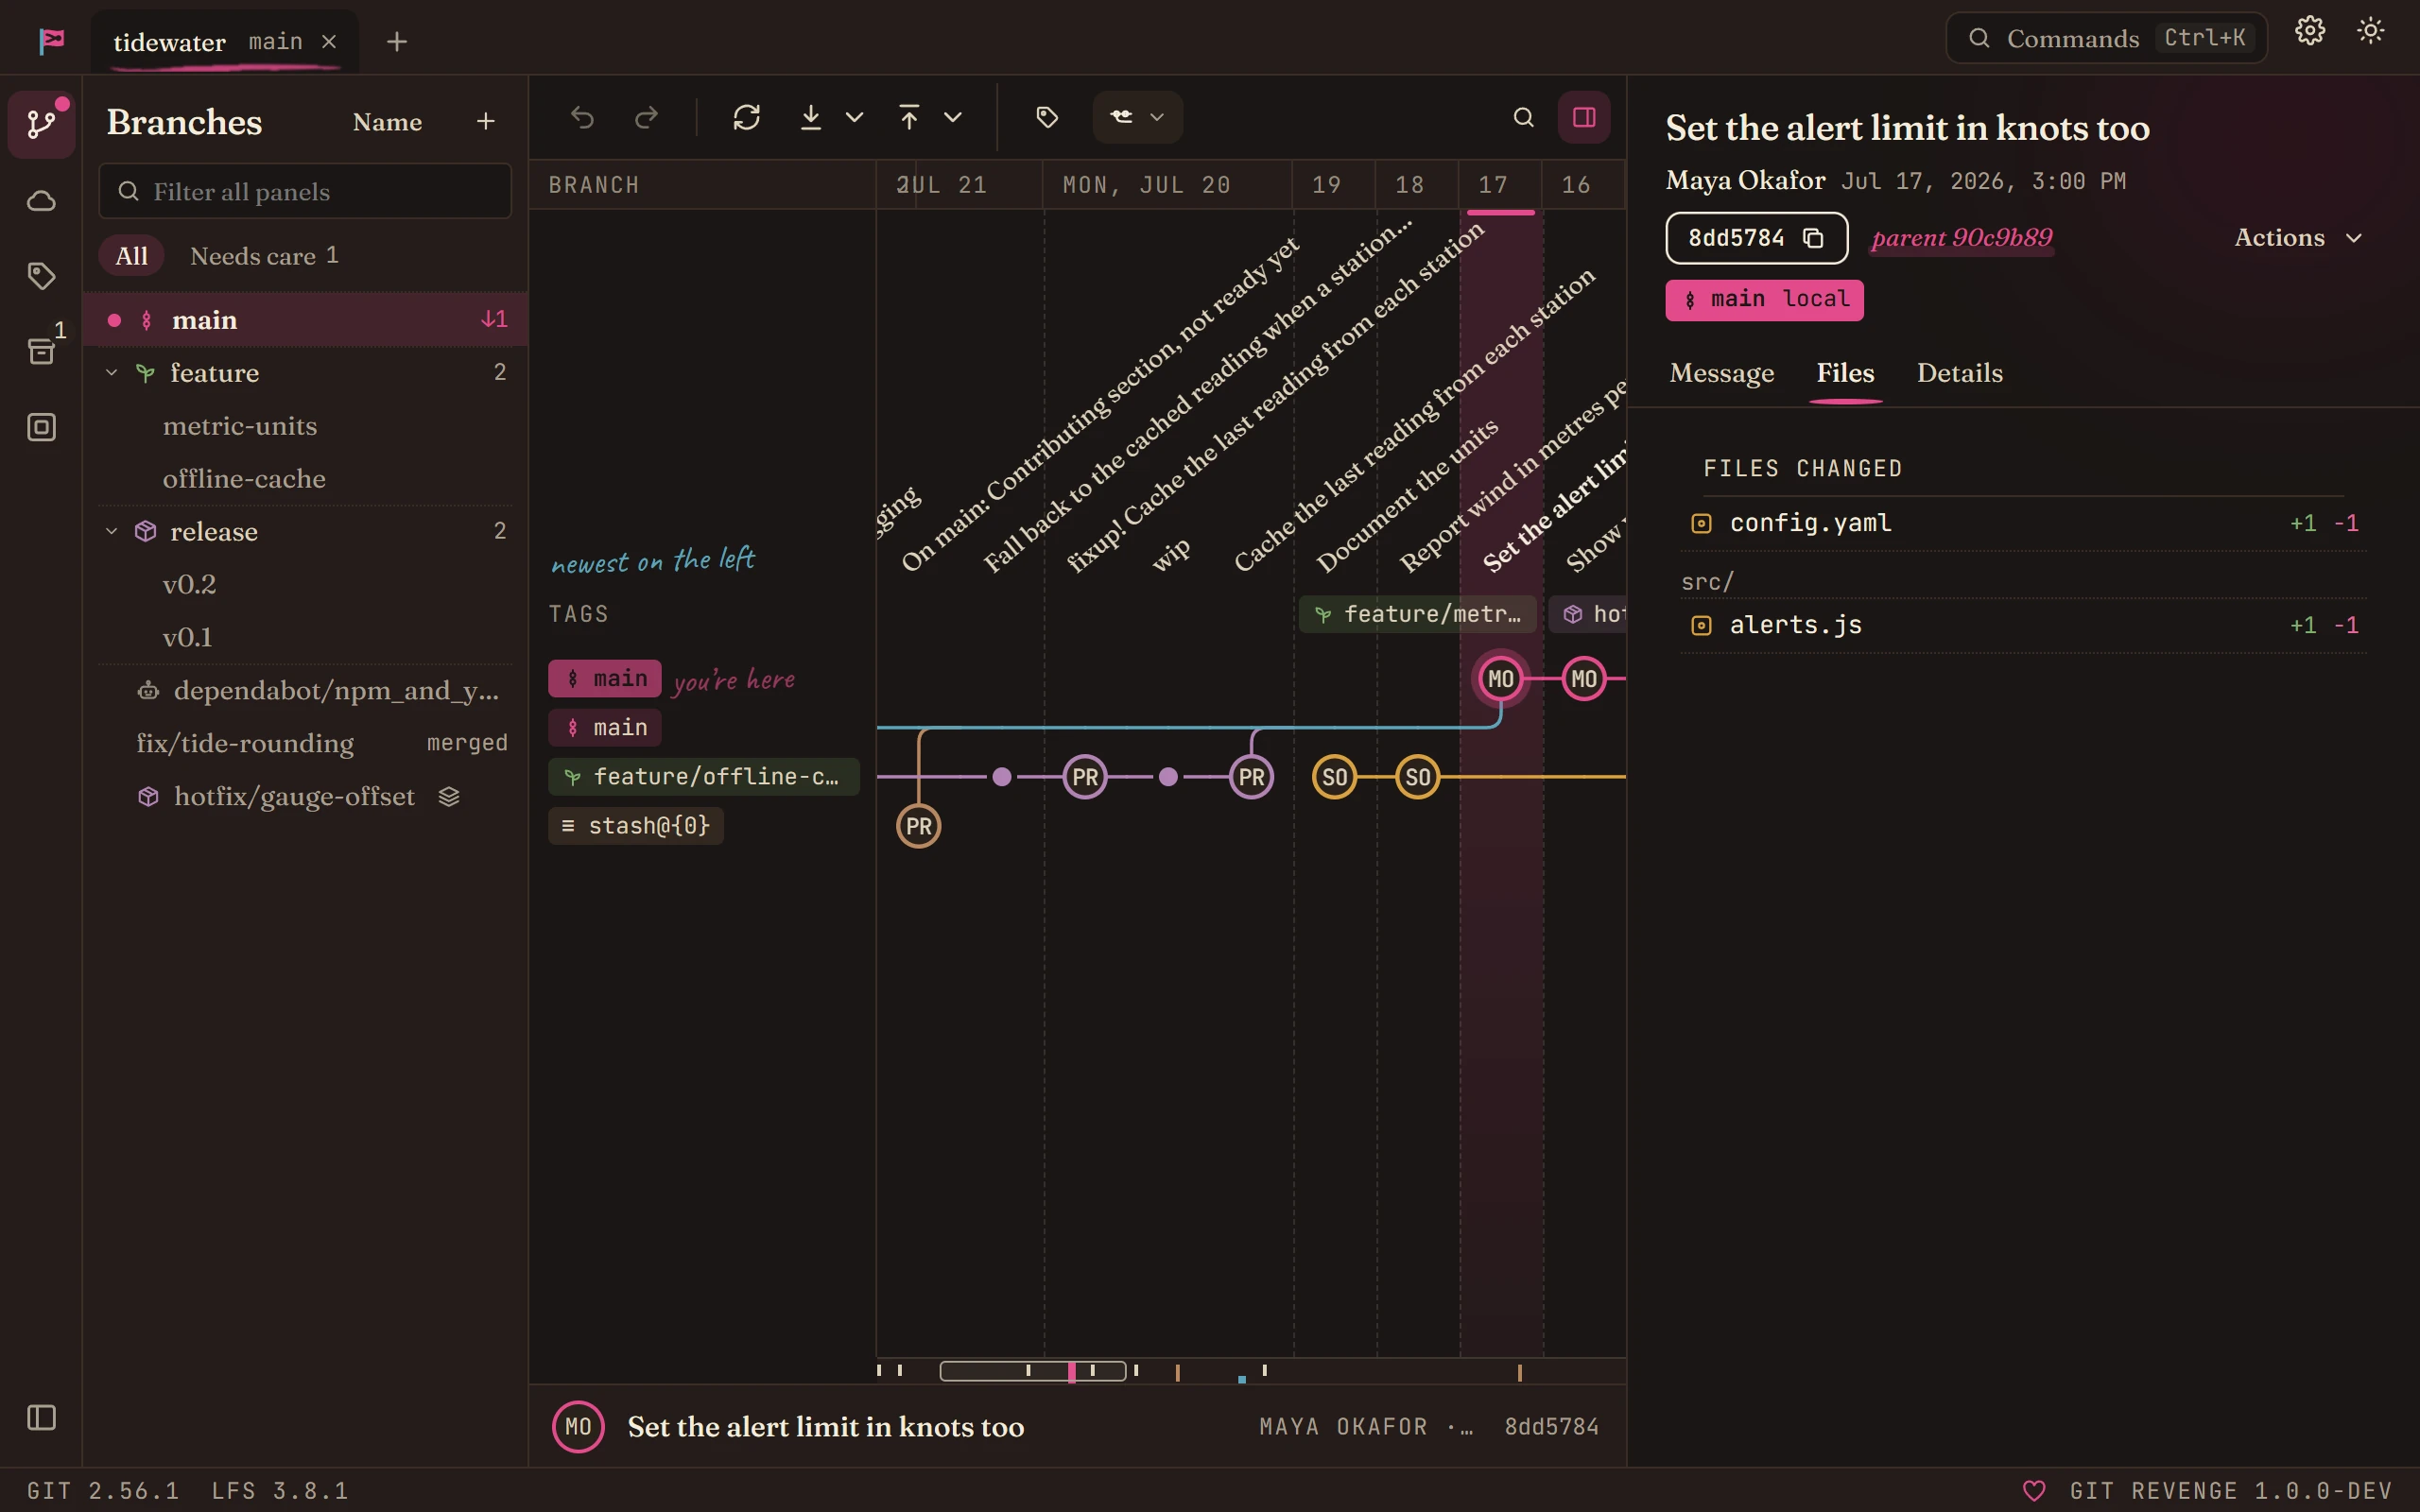
- Lane names. A pinned column on the left names each lane after the branch whose tip started it, even once that tip has scrolled away. Lanes are reused from one branch to the next, so the names belong to the commits at the left edge and change as you scroll. A lane that a merge closed is named from the merge's subject, such as the branch a pull request came from.
- Labels. Branch and tag labels sit on their commits, and a row along the top holds the tags.
- Days. A band along the top marks where each day starts.
- Working tree. Your uncommitted changes are the leftmost column, before the newest commit. Click it, or press ← from the newest commit, to open them.
- Folded lanes. Bot and Docs lanes fold here too: a day's commits on such a lane take one column. Click the column to open it.
- Ruler. The scrollbar along the bottom is the timeline's ruler turned on its side: its length is the whole history, with ticks for branches, tags, the checked-out commit and search matches. Drag the box, or press anywhere on it to go there.
The wheel scrolls through time. With Shift held, it scrolls the lanes, when there are more than fit. From the keyboard, → moves to an older commit and ← to a newer one, Page Up and Page Down move a screenful, and Home and End go to the newest and the oldest.
Selecting a commit, right-clicking it for its menu, and dragging one commit onto another work as they do in the timeline.
Map
Map has no commits in it. Each branch and tag is a node, held around the trunk in the middle. (It has a second mode with a node for each person; see Authors below.) A node's size is how many commits it has of its own, and its distance from the trunk is how long since it last moved, so the branches being worked on gather close in and the forgotten ones drift out. It's a way to see the shape of a busy repository and find your way into it, not a place to work.
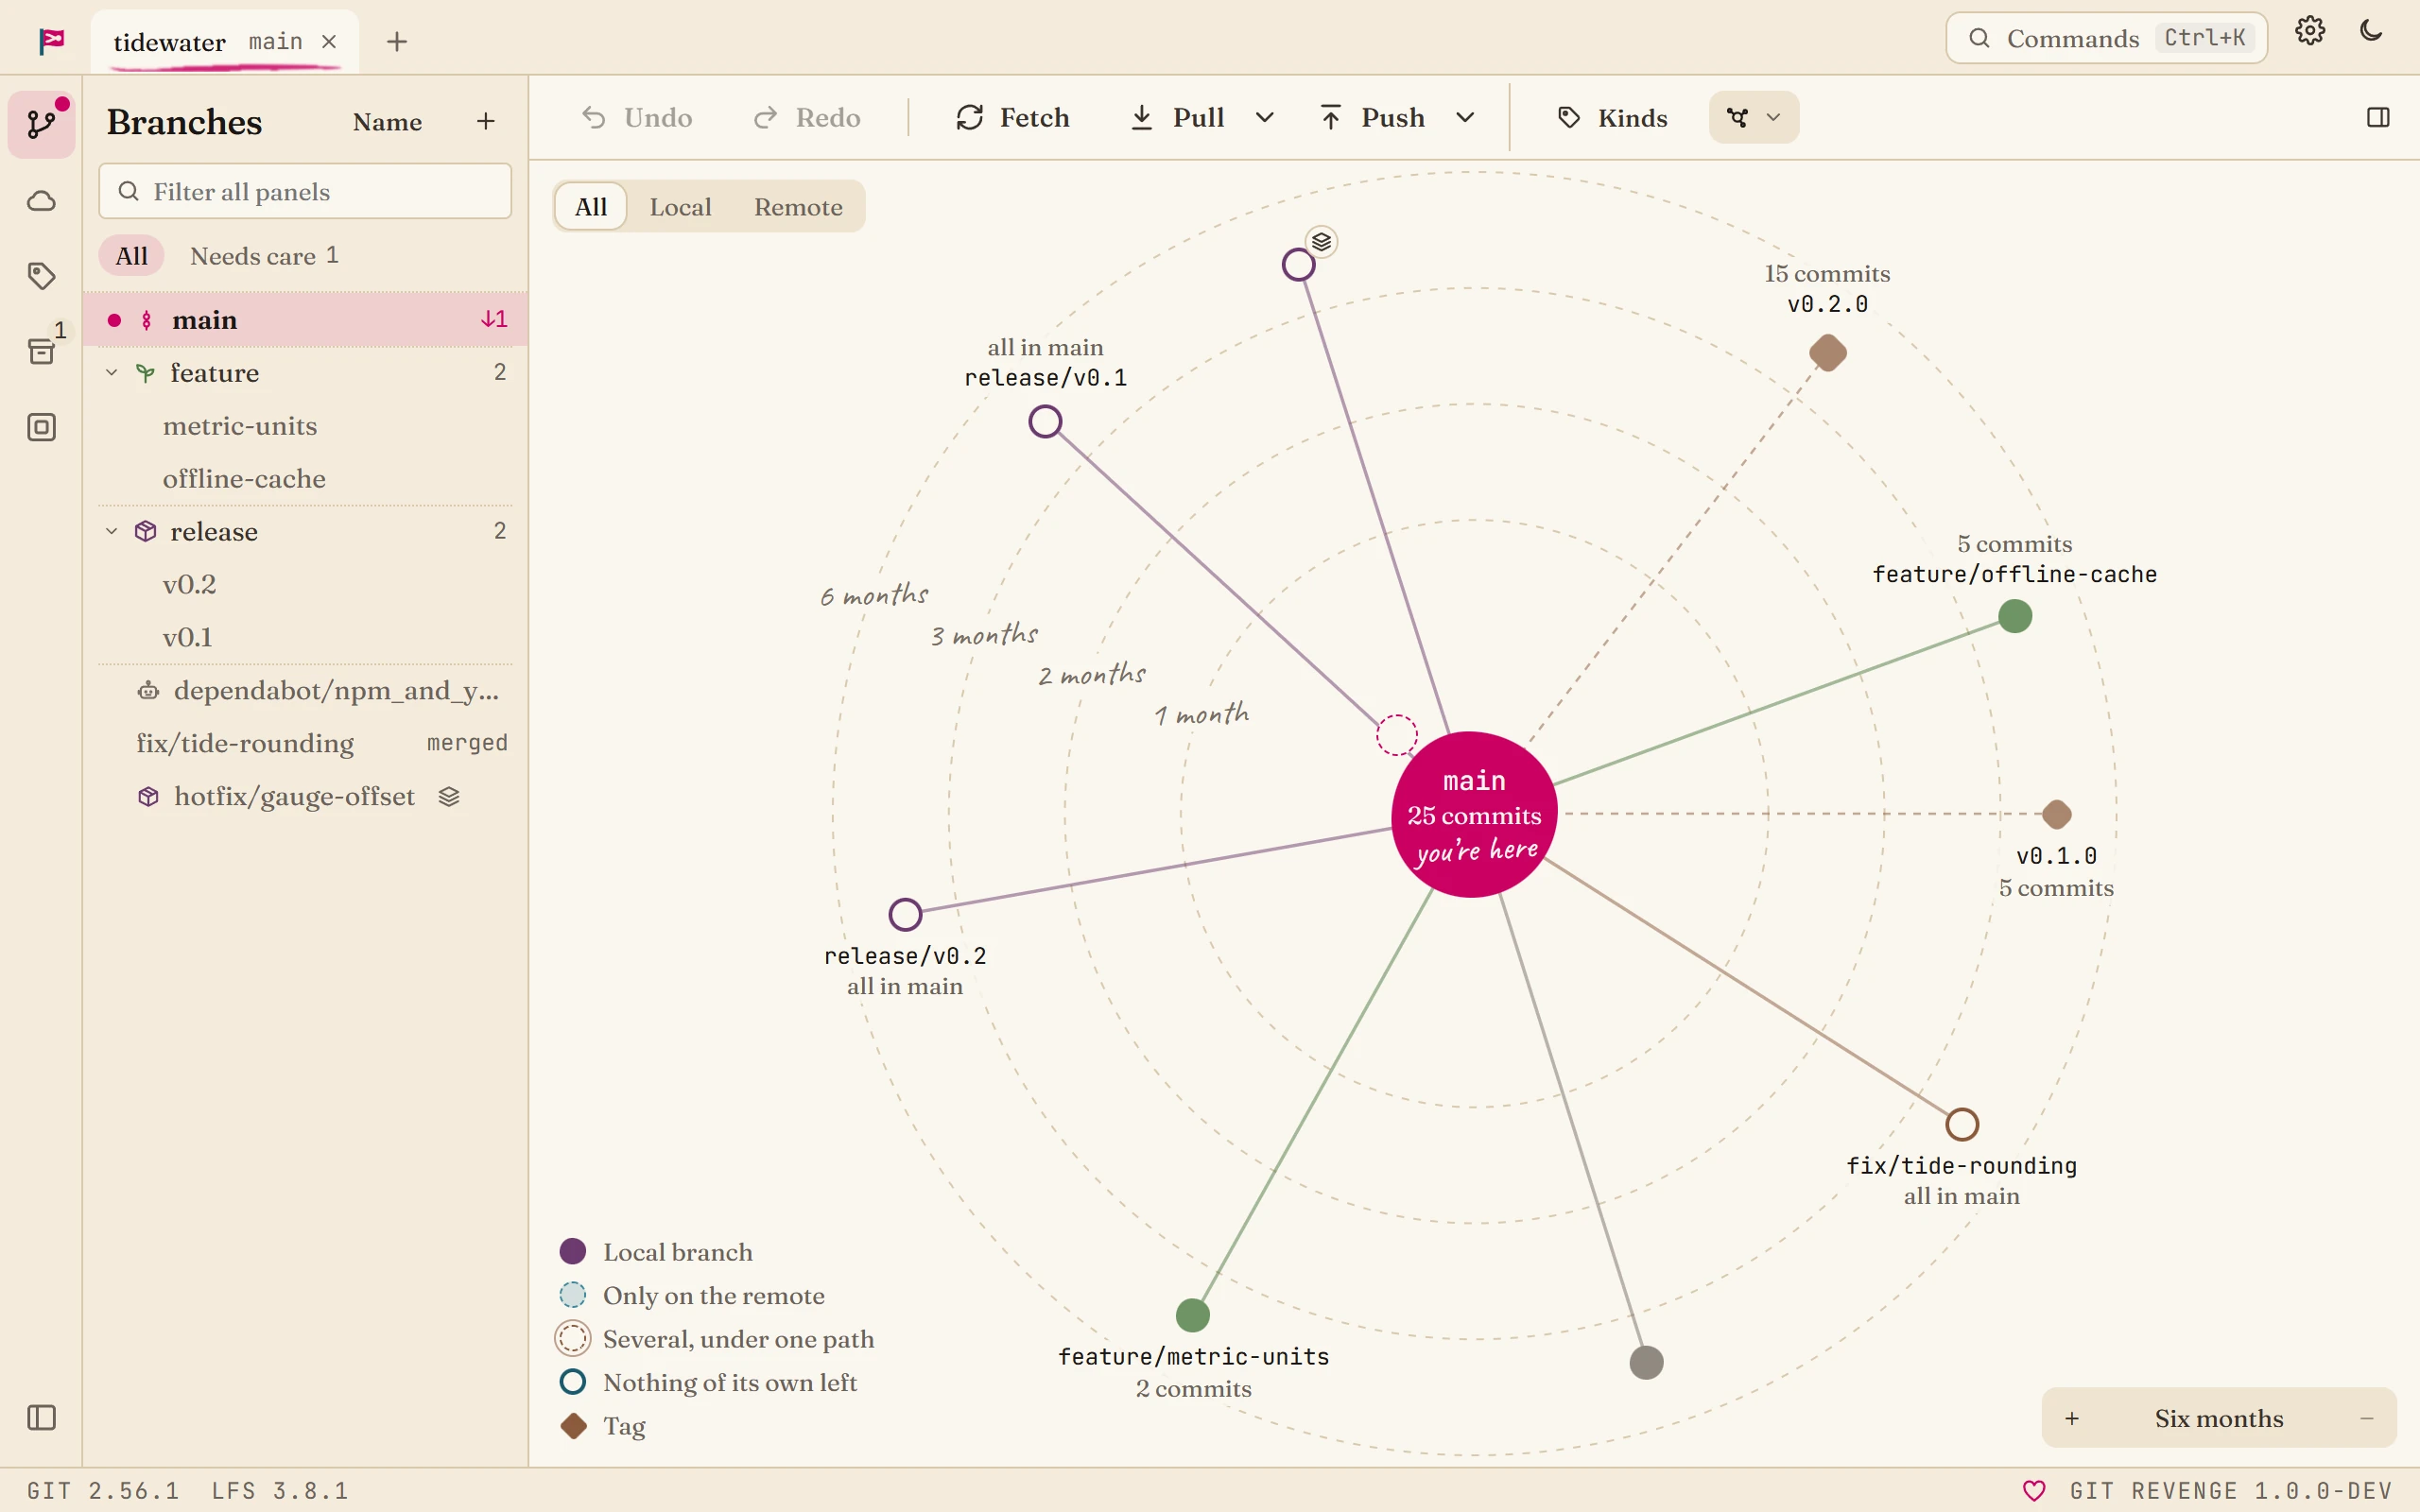
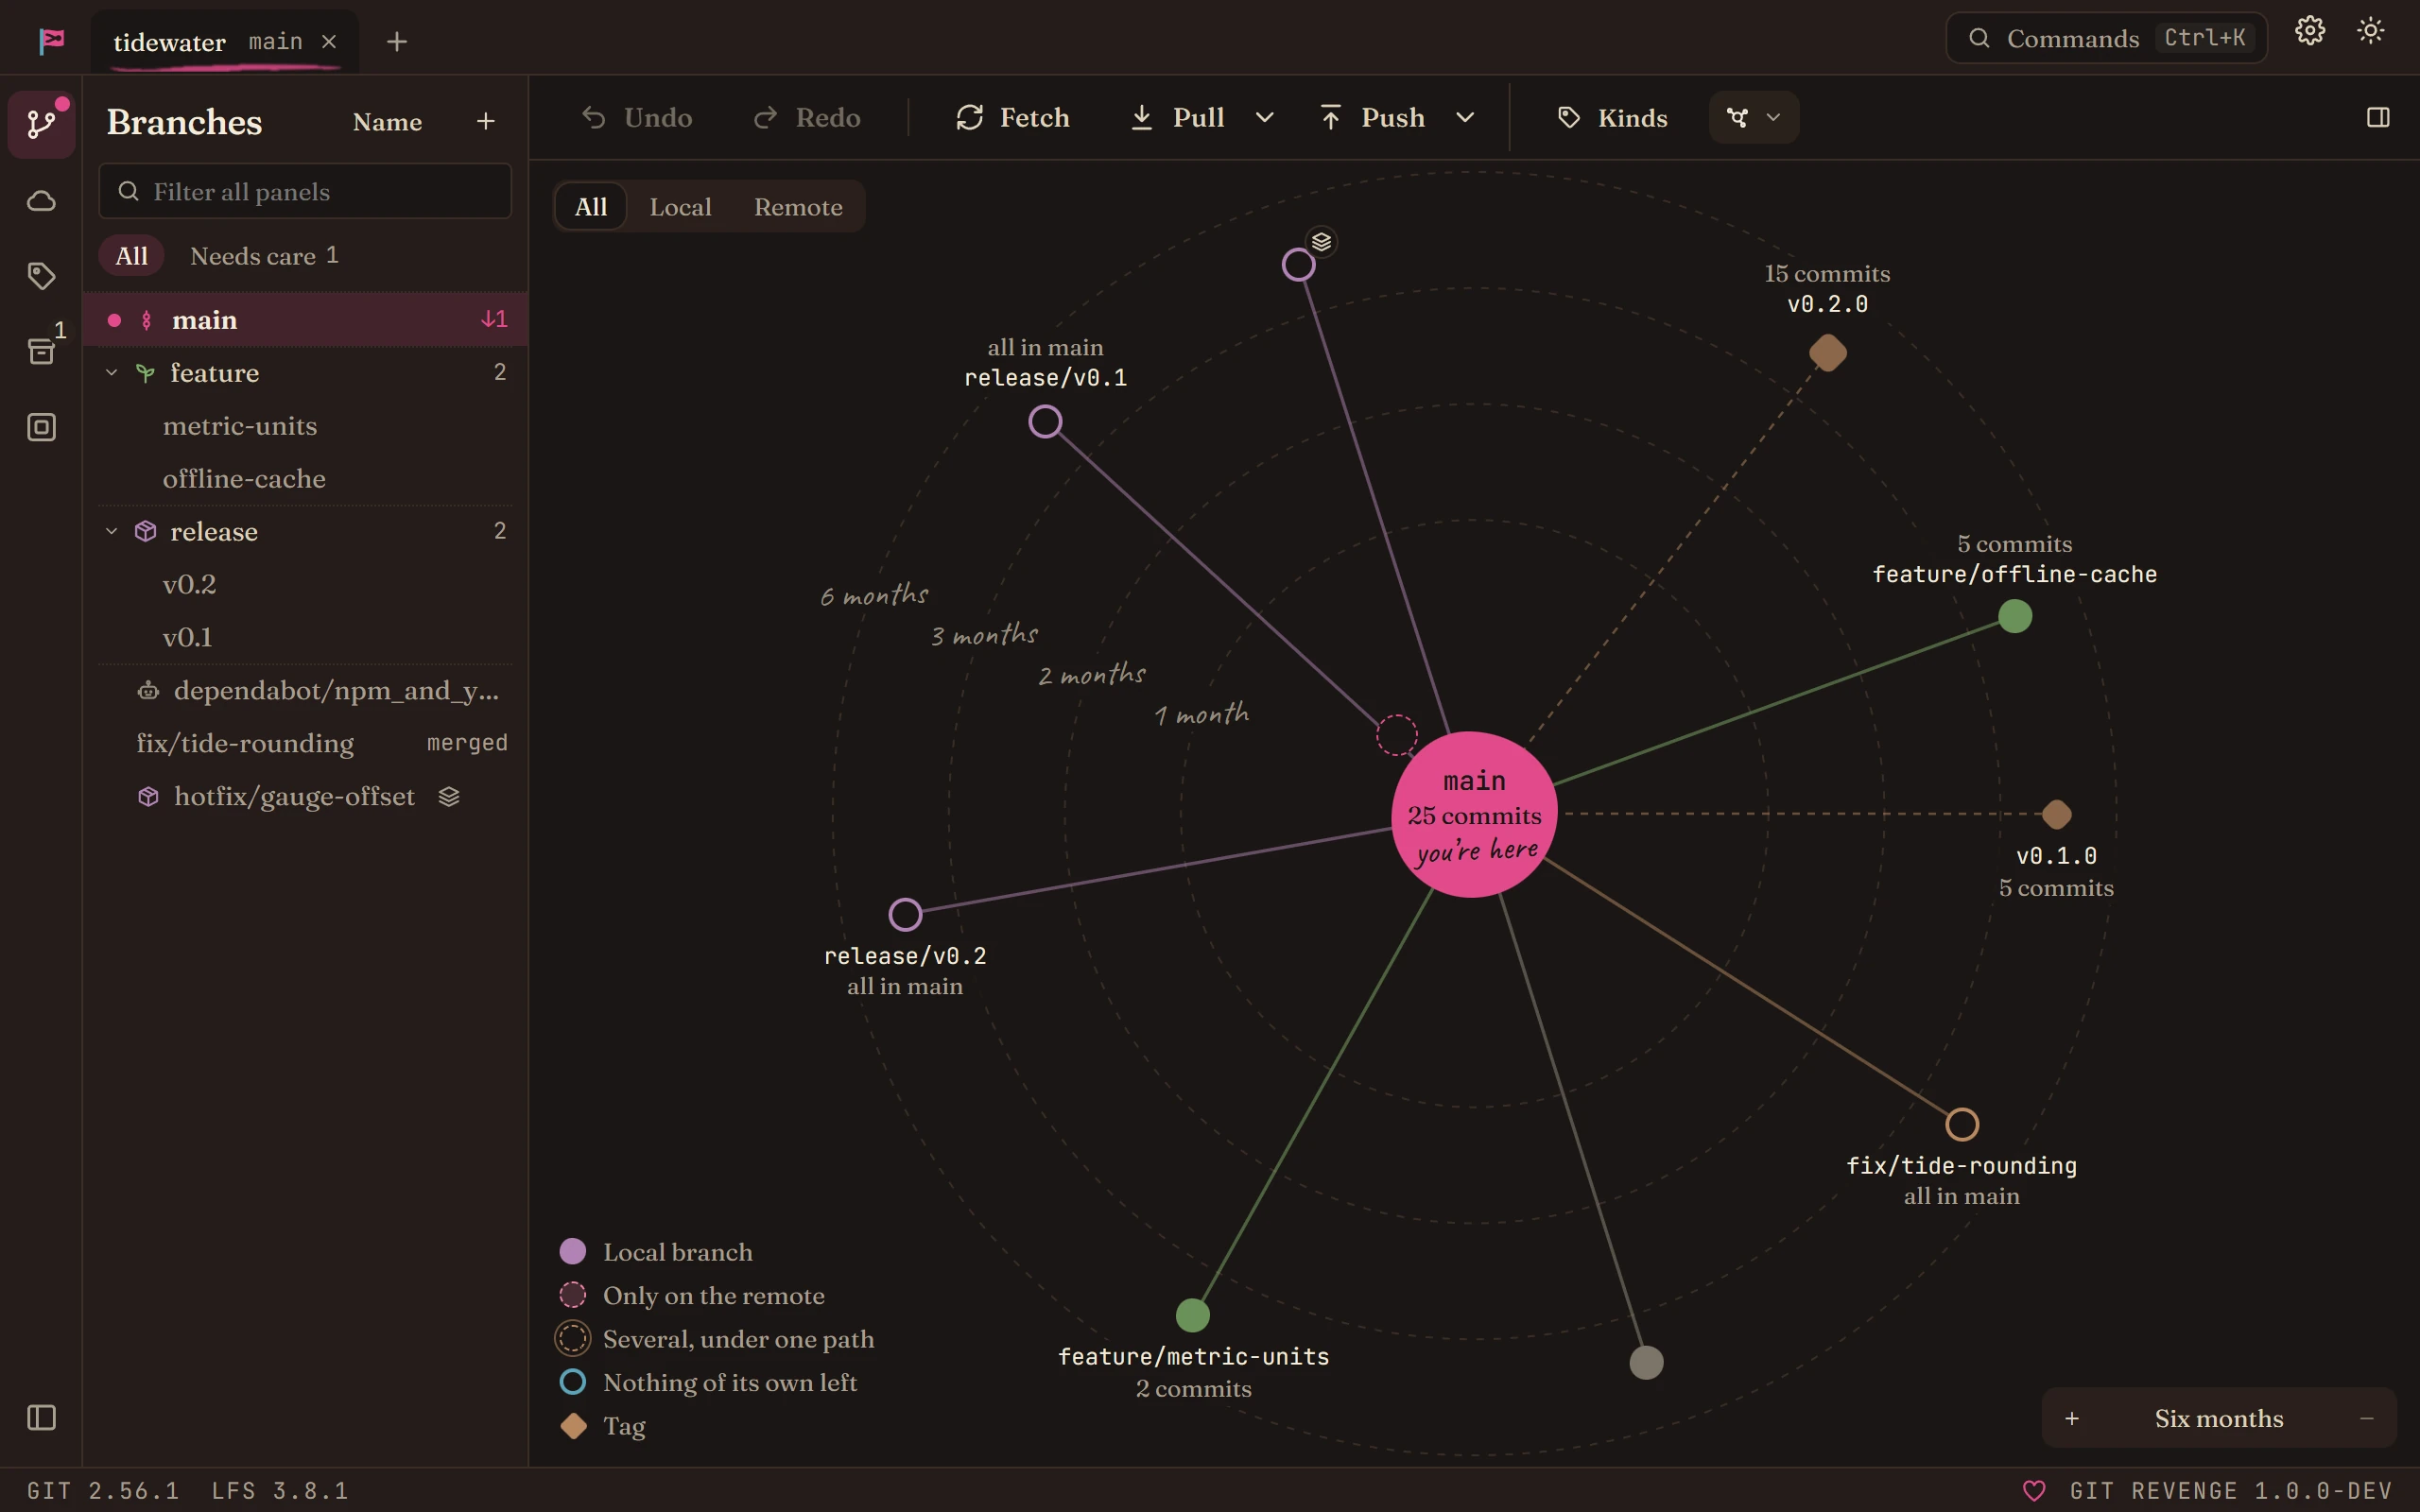
The key in the bottom left tells the nodes apart: a local branch, a branch that's only on the remote, a branch with nothing of its own left (merged), and a tag. The checked-out branch is always named, and says "you're here". A branch checked out in another worktree carries a worktree badge, and a branch stacked on another hangs off that branch instead of the trunk. Your working tree is a small node beside the checked-out branch; click it to open your changes.
Click a node for its card: what it is, how many commits, when it last moved, and buttons to Show it in the timeline or, for a branch, Focus the timeline on it. Right-click a node for the same menu it has in the sidebar.
- Rings. Rings round the trunk mark time, and each is named along whichever side is clearest of nodes. Zoom with the + and − buttons in the bottom right, the + and − keys, or the wheel: all the way in, the map is one week with a ring a day; out, the rings become weeks, then months, then years. The map opens at the zoom that fits most of the repository, and remembers the zoom you choose for each one. What's older than the last ring isn't drawn: a tally past it says how many, and zooming out brings them in.
- Names. In a crowd there isn't room for every name. The checked-out branch, nodes you've pinned and local branches are named first, then the rest by size, and a name that would cover another is left off. Hover over a node, or move to it with Tab, to see its name.
- Pins. Drag a node to put it somewhere else. It stays there for that repository, and the rest make room for it. Double-click it, or choose Let it go back to its place on its card, to let it go.
- Groups. A repository with hundreds of remote branches would bury the map. Remote-only branches that share the first part of their name (
dependabot/,release/) become one node when there are three or more. Double-click a group, or click it and choose Show its branches: they stand round it, and only then are their commits counted. - All, Local, Remote. The second switch in the top left shows every branch, only your local ones, or only those that are on the remote alone. The choice is kept for each repository.
The bar above the graph says what the map holds, such as "8 branches · 13 tags".
The walkthrough Find your way round a busy repository uses the Map to pick a branch and focus the timeline on it.
Authors
The first switch in the top left, Branches / Authors, turns the map from branches to the people who wrote the commits. Each person is a node around the trunk. A node's size is how many commits they made in the span of time the rings cover, and its distance from the trunk is how long since their last one. Whoever is doing the most is big and close in; someone who wrote a lot and has moved on is big and far out.
- The span. Zoom sets it, from a week to ten years, and the bar above the graph says which: "14 people · 2 bots in the last two months". Zoom in to see who's doing the most now, and out to see who has done the most. The mode opens at two months, or further out if the trunk has been quiet for longer, and keeps its own zoom apart from the branches'. Each change of span reads the history again, which takes a few seconds on a very long one.
- What counts. A commit counts for its author and for each person a
Co-authored-byorCo-developed-bytrailer names, so the sizes add up to more than the repository's commits. Merge commits count for nobody. The author is read, never the committer, so work that was rebased, cherry-picked or squashed on a hosting service stays with whoever wrote it. - Who is one person. Names and emails go through the repository's mailmap first: the one the graph reads, so a
.mailmapyou've saved counts before it's committed. After that, anyone sharing an email or sharing a name is one person, named for the identity they used most. A person's card lists every name and email counted as them, so a wrong match shows. - Everyone, People, Bots. The second switch chooses who shows, and opens on People. A bot is drawn dashed, with the Bot icon. An author is a bot when the name ends in
[bot]or matches one of the repository's bot author patterns. - You. Your own node says "that's you". It's always named, and always drawn, however many others there are.
- The card. Click a person for their commits in the span, split into written and co-authored, when they last committed, and how much they've written in all. Search the timeline for them goes to the timeline with their name in the search.
- Limits. The map draws the 60 people with the most commits in the span; the bar and the key say how many more there are.
Double-click a person, or use their card, to open them. What they worked on stands round them, in their colour. By branch / By area, beside the second switch, chooses what that is, for everyone who's open:
- By branch. A ring for what of theirs has landed in the trunk, and a node for each unmerged branch that holds commits of theirs, sized by those commits. A branch node has the card and the right-click menu it has among the branches.
- By area. The folders their commits touched, each sized by how many of their commits touched it. Double-click a folder to open it into its own folders, as far down as you like. A folder's card lists their latest commits there, and each goes to that commit in the timeline. A commit counts once for every folder it touches. In a repository that squash-merges, where everyone's branch is the trunk, this is the way to see who works where.
Pins work here as they do among the branches: drag a person, a branch or a folder to keep it somewhere. A double-click on something pinned lets it go, as it does there, so open a pinned person or folder from its card.
Any number of people can be open at once. Point at a branch or a folder and the same one lights up under everyone else who's open, which shows who else works there. Which people are open isn't remembered; the mode, who shows and the choice between branches and areas are, for each repository.
The map shows what the commits record. If someone squashes another person's branch on their own machine with git merge --squash, git records the person who squashed as the author, and the map has no way to know otherwise. It's also measured from now, so the same repository looks different next month: it's for finding your way round, not for a report. Insights is the place for numbers that can be reproduced.